This English version was translated by Hermes Agent.
Some users reported that requests sent from the screen were failing with a CORS error.
I opened a PR to change a Tomcat setting while investigating the cause, but one question remained:
"Why was none of this visible in our monitoring or logs?"
This article follows that question through Tomcat's structure and fills the gap with a Tomcat Valve.
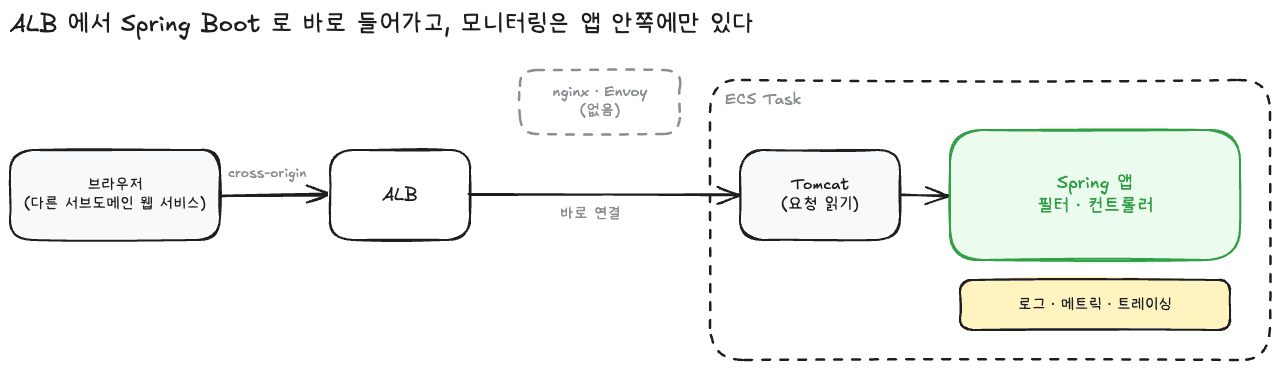
First, here is the infrastructure involved:
The browser developer tools showed only a CORS error. Two things were strange:
The CORS error here does not mean that the CORS configuration was wrong.
If a response does not contain CORS headers, the browser hides the response for a cross-origin request regardless of the actual reason,
and leaves ablocked by CORS policy …message in the console. The 400 response simply did not have those headers.
When I reproduced the failed request as-is, the response was the 400 Bad Request described above, not a CORS problem.
The response also did not contain an Access-Control-Allow-Origin header.
The cause was the request-header size.
.example.com is sent to all of its subdomains.Tomcat returns 400 as soon as it detects that the headers exceed the limit, without processing the rest of the request.
At that point, the request never reaches the Spring filters.
Adding CORS headers is also the filter's responsibility, so the 400 response does not contain them.
When a cross-origin response lacks CORS headers, the browser shows only a CORS error instead of exposing the status code to JavaScript.
=> The actual cause was a 400, but the symptom looked like a CORS error.
I sent the same request again to a test Tomcat endpoint. In the screenshots below, the Console shows both the CORS policy block and the 400 failure, while the Network tab shows that the actual HTTP status for the same request was 400 Bad Request.

The Console shows the CORS policy message together with the network request's 400 failure.
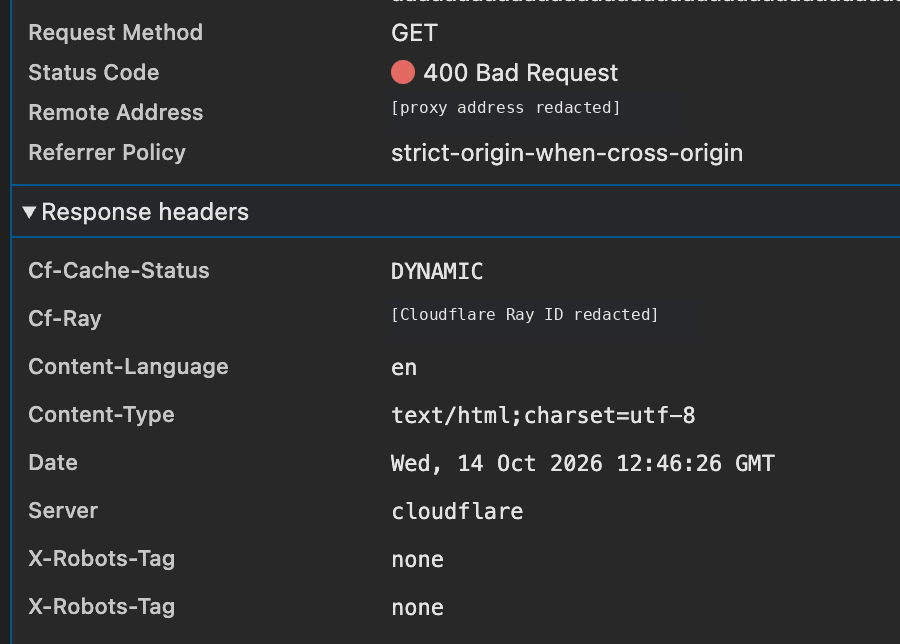
The actual response status in the Network tab is 400 Bad Request, and there is no Access-Control-Allow-Origin header.
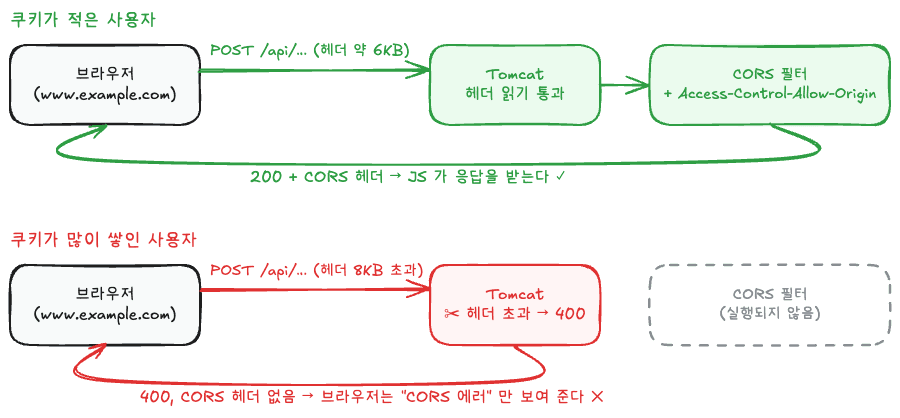
This also explains why only some users failed: only users with enough accumulated cookies crossed the boundary.
The immediate fix was to raise the limit.
server:
  max-http-request-header-size: 16KB # 기본 8KB
Fundamentally, cookies should not be sent with requests that do not need them.
Possible approaches include narrowing the scope of parent-domain cookies or keeping fetch's credentials at its default value (same-origin) for API calls that do not need cookies.
This is not central to this article, so I will leave it out.
This reminded me of something I encountered recently.
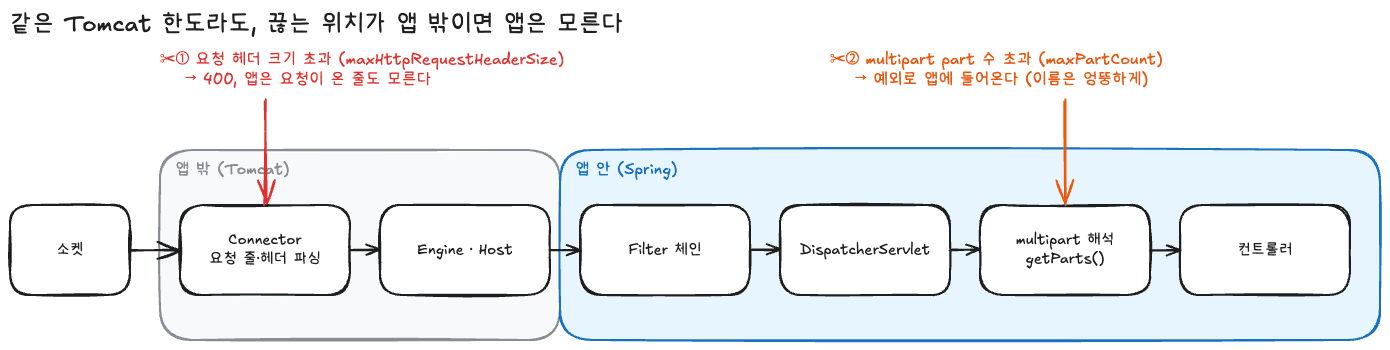
In the story of a multipart request breaking after upgrading to Spring Boot 3.5, I described hitting Tomcat's limit on the number of multipart parts.
| Multipart part limit | Request-header size limit | |
|---|---|---|
| Limit that was hit | Tomcat maxPartCount | Tomcat maxHttpRequestHeaderSize |
| What the user saw | 500 response | CORS error in the browser console (actually a 400 without CORS headers) |
| What appeared in the server logs | MaxUploadSizeExceededException (a name that looked like a file-size problem) | Almost nothing (occasionally Tomcat INFO) |
| Did the application know? | It entered the application as an exception, although the name was misleading | The application did not know at all |
Both cases hit a default Tomcat limit, and the symptoms appeared to come from somewhere else.
There is also an important difference.
The multipart limit is triggered when the application calls getParts(), so it does reach the application as an exception, even though the exception name is misleading.
The header-size limit, on the other hand, rejects the request before the application receives it, leaving no trace there at all.
At the end of the previous article, I wrote that an environment that can detect problems quickly is as important as upgrading quickly.
This time, I encountered a place where even that detection did not happen.
If the application could not see the request, Tomcat must have left something behind. In fact, Tomcat logs errors like this:
INFO  o.a.coyote.http11.Http11Processor - Error parsing HTTP request header
 Note: further occurrences of HTTP request parsing errors will be logged at DEBUG level.
java.lang.IllegalArgumentException: Request header is too large
The second line was the problem. In other words: "log subsequent occurrences at DEBUG."
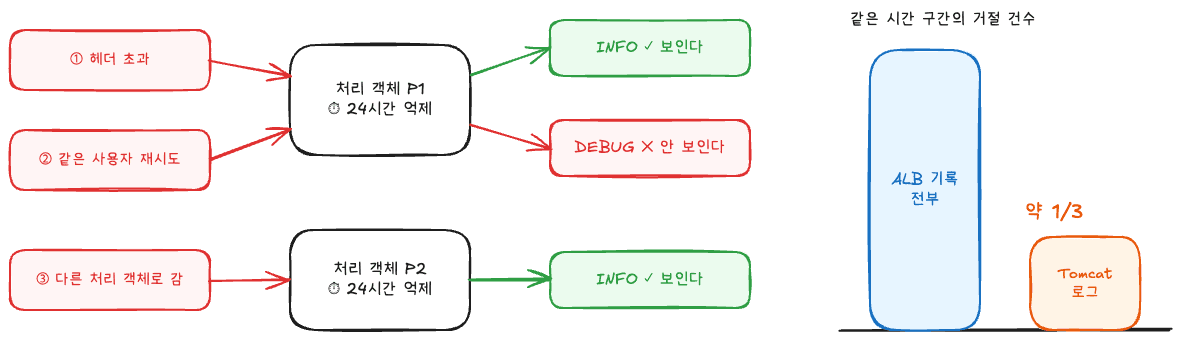
Tomcat logs this kind of error at INFO the first time and at DEBUG for the next 24 hours.
Since operational log levels are usually set to INFO, the error effectively disappears after the first occurrence.
I compared the ALB access logs to see how many were missing.
Over the same time period, it appeared that only about one third of the actual rejections remained in the Tomcat logs.
(The 24-hour suppression is tracked per request-processing object rather than across the whole server, so not every occurrence disappears.)
One user had also been failing the same request continuously for several days.
To summarize:
=> We needed a place on our side that could observe, every time, what Tomcat had decided and ended before the application.
First, let us trace how a request is processed inside Tomcat.
Tomcat can be broadly divided into two parts:
Http11Processor, which reads the request line and headers, lives here.Engine → Host → Context → Wrapper.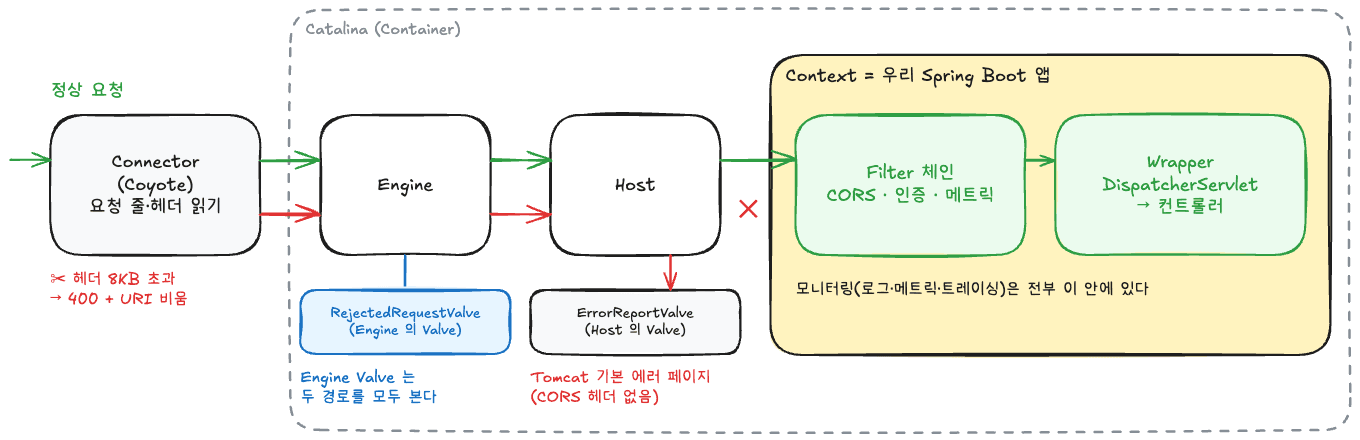
Here, Context is one web application—in this case, our Spring Boot application.
The servlet Filters we use (the CORS filter, authentication filter, HTTP metrics filter, and so on) are all inside this Context.
What happens when the headers exceed the limit? I followed the Tomcat 10 source.
헤더 8KB 초과
  → Http11InputBuffer: IllegalArgumentException("Request header is too large")
  → Http11Processor: 응답 상태를 400 으로 정하고 에러 표시
  → CoyoteAdapter: 에러가 표시된 요청은 URI 를 비우고 매핑
       → Host 까지만 찾고, Context(= 앱)에는 매핑되지 않음
  → Host 의 ErrorReportValve 가 Tomcat 기본 에러 페이지를 씀
Tomcat intentionally clears the URI so that it does not pass broken data to the application.
As a result, the request reaches only the Host, and none of the Filters inside the Context execute.
That is why our monitoring could not see the request: all of our monitoring was inside the application Context.
Why, then, did Tomcat itself suppress most of the logs?
When header parsing fails, Http11Processor does the following:
// Http11Processor.java
} catch (Throwable t) {
    ExceptionUtils.handleThrowable(t);
    UserDataHelper.Mode logMode = userDataHelper.getNextMode();
    if (logMode != null) {
        String message = sm.getString("http11processor.header.parse"); // "Error parsing HTTP request header"
        switch (logMode) {
            case INFO_THEN_DEBUG:
                message += sm.getString("http11processor.fallToDebug"); // "Note: further occurrences ... DEBUG level."
                //$FALL-THROUGH$
            case INFO:
                log.info(message, t);
                break;
            case DEBUG:
                log.debug(message, t);
        }
    }
    // 400 - Bad Request
    response.setStatus(400);
    setErrorState(ErrorState.CLOSE_CLEAN, t);
}
UserDataHelper decides which log level to use.
It controls how much of a user's malformed input should be written to the logs.
// UserDataHelper.java (일부 생략)
public UserDataHelper(Log log) {
    this.log = log;

    Config tempConfig;
    String configString = System.getProperty("org.apache.juli.logging.UserDataHelper.CONFIG");
    if (configString == null) {
        tempConfig = Config.INFO_THEN_DEBUG; // 기본값
    } else {
        // ...
    }

    // Default suppression time of 1 day.
    suppressionTime = Integer.getInteger("org.apache.juli.logging.UserDataHelper.SUPPRESSION_TIME", 60 * 60 * 24).intValue() *
                    1000L;
    // ...
}

private boolean logAtInfo() {
    // ...
    long now = System.currentTimeMillis();

    if (lastInfoTime + suppressionTime > now) {
        return false; // 마지막 INFO 로부터 24시간이 안 지났으면 DEBUG 로
    }

    lastInfoTime = now;
    return true; // 처음이거나 24시간이 지났으면 INFO
}
The default is INFO_THEN_DEBUG, and the suppression period is 24 hours.
getNextMode() returns INFO when logAtInfo() is true, and DEBUG otherwise.
This behavior can be changed with a system property.
Passing -Dorg.apache.juli.logging.UserDataHelper.CONFIG=INFO_ALL logs every occurrence at INFO
(SUPPRESSION_TIME=0 has the same effect).
However, even if every occurrence is logged, the message does not identify the request with a method or path. It contains only the reason and stack trace.
So we needed a different place.
The boxes attached below Engine and Host in the earlier Tomcat structure diagram (RejectedRequestValve and ErrorReportValve) are Valves, and they are the main subject of this article.
RejectedRequestValve is a Valve that we build ourselves later.
The diagram shows only the Valves relevant to this story; in reality, each container can have multiple Valves attached to it.
Each Tomcat container (Engine, Host, Context, and Wrapper) has its own Pipeline.
A Pipeline is a chain made by linking Valves in order.
public void invoke(Request request, Response response) {
    // 앞에서 할 일
    getNext().invoke(request, response); // 다음 Valve 로 넘긴다
    // 뒤에서 할 일
}
Its shape is almost identical to a servlet Filter's
chain.doFilter().
Each Pipeline ends with a standard Valve (StandardEngineValve, StandardHostValve, and so on) that passes the request to the next container.
This may sound unfamiliar, but you may already be using it.
Tomcat provides several built-in Valves, and some Spring Boot settings are effectively switches that enable these Valves.
| Valve | What it does | How to enable it in Spring Boot |
|---|---|---|
AccessLogValve | Access logging | server.tomcat.accesslog.enabled |
RemoteIpValve | Restores the actual client IP from X-Forwarded-For | server.forward-headers-strategy=native |
ErrorReportValve | Tomcat's default error page | Automatically configured by Spring Boot |
| Filter | Valve | |
|---|---|---|
| Standard | Servlet specification (works in any servlet container) | Tomcat-specific |
| Location | Inside the Context (application) | Pipeline of the Engine, Host, or Context |
| Requests it can see | Only requests mapped to the application | Requests that reach the Engine or Host, even if they never enter the application |
| Registration | @Component, FilterRegistrationBean | server.xml; in Spring Boot, TomcatServletWebServerFactory |
For ordinary request processing, a Filter is the right choice. It is standard, and it remains portable if you change web servers.
A Valve becomes useful when we need to handle something that a Filter cannot reach.
That is the case here: the request ends before entering the application Context.
A Valve attached to the Engine also sees requests that reach the Host and end there, so it can observe them.
If there is a gateway in front of the application, the gateway can do the same job.
error_page 494.Our architecture did not have that observation point, so we implemented it directly inside Tomcat.
/**
 * 앱(Context)에 닿기 전에 Tomcat 이 예외를 던지며 거절한 요청을 남긴다.
 * 정상 사용자를 막는 헤더 초과만 ERROR 로 알리고, 나머지 형식 위반은 WARN 으로만 남긴다.
 */
@Slf4j
public class RejectedRequestValve extends ValveBase {

    /** ALB 가 요청마다 붙이는 식별자. ALB 접근 로그의 trace_id 와 같은 값이다. */
    static final String ALB_TRACE_HEADER = "X-Amzn-Trace-Id";

    /** 요청 줄과 헤더를 합친 크기가 상한을 넘을 때 Tomcat 이 던지는 메시지. 쿠키 누적·긴 URL 로 정상 사용자도 걸린다. */
    static final String HEADER_TOO_LARGE = "Request header is too large";

    public RejectedRequestValve() {
        // false 면 Engine 을 지나는 모든 요청의 async 지원이 꺼진다
        super(true);
    }

    @Override
    public void invoke(Request request, Response response) throws IOException, ServletException {
        getNext().invoke(request, response);
        Throwable cause = (Throwable) request.getAttribute(RequestDispatcher.ERROR_EXCEPTION);
        if (request.getContext() != null || cause == null) {
            return; // 앱이 처리한 요청은 기존 로그·메트릭이 본다
        }
        String reason = truncate(cause.getMessage(), 200);
        if (HEADER_TOO_LARGE.equals(cause.getMessage())) {
            log.error("앱 도달 전 거절 status={} method={} uri={} trace={} reason={}",
                    response.getStatus(), request.getMethod(), request.getRequestURI(),
                    request.getHeader(ALB_TRACE_HEADER), reason, cause);
            return;
        }
        // 헤더 초과가 아닌 형식 위반(잘못된 문자·헤더 줄 등)은
        // 정상 브라우저가 거의 보내지 않고 대부분 스캐너라, 알림 없이 WARN 으로만 남긴다
        var uri = request.getRequestURI();
        var trace = request.getHeader(ALB_TRACE_HEADER);
        log.warn("앱 도달 전 거절 status={} method={} uri={} trace={} reason={}",
                response.getStatus(), request.getMethod(), uri, trace, reason);
    }

    private static String truncate(String text, int max) {
        return text == null || text.length() <= max ? text : text.substring(0, max) + "...";
    }
}
There are three key conditions.
request.getContext() == null: the request ended without being mapped to the application.
Context, so it does not match here.Context for all paths, so a normal request always has a Context.cause != null: only record a rejection where Tomcat threw an exception.
jakarta.servlet.error.exception request attribute (RequestDispatcher.ERROR_EXCEPTION).Request header is too large, record it at ERROR and include the exception.
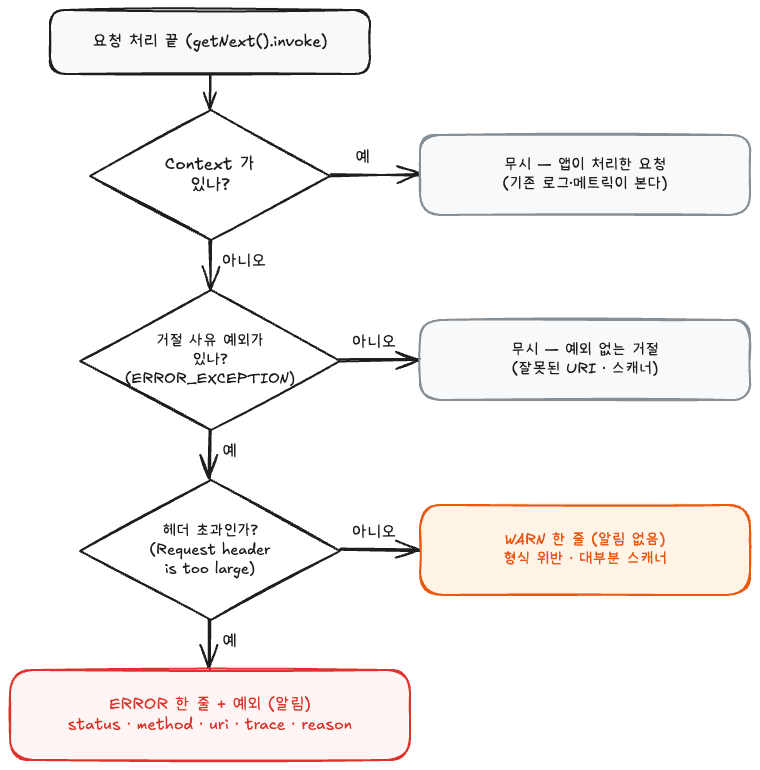
There is a reason for the second condition.
At first, I recorded every 4xx response that failed to enter the application. When I reproduced the cases, some requests were rejected without an exception.
uri=/api/a%2Fb            → 400, 예외 없음 (인코딩된 슬래시)
uri=/api/../../etc        → 400, 예외 없음 (상위 경로)
uri=/api/%2e%2e/%2e%2e/x  → 400, 예외 없음
Requests such as ../../etc are a common shape for scanners testing path traversal attacks.
Recording all of them could create log noise, so the scope is narrowed to "rejections where Tomcat throws an exception."
@Configuration
public class TomcatConfig {

    /** 앱에 닿기 전에 거절된 요청은 Context 를 지나지 않으므로 Engine 에 붙인다. */
    @Bean
    public WebServerFactoryCustomizer<TomcatServletWebServerFactory> rejectedRequestValveCustomizer() {
        return factory -> factory.addEngineValves(new RejectedRequestValve());
    }
}
If we attach it to the Context, the requests we want to observe never reach it.
That is why this uses addEngineValves rather than addContextValves.
Header parsing failures cannot be reproduced with MockMvc. MockMvc does not pass through Tomcat.
So I started a real Tomcat with the same factory Spring Boot uses to start the application and sent a raw HTTP request over a socket.
This verifies registration and behavior together without needing a Docker container or the full application context.
@BeforeEach
void setUp() {
    var factory = new TomcatServletWebServerFactory(0);
    new TomcatConfig().rejectedRequestValveCustomizer().customize(factory);
    server = factory.getWebServer(ctx -> ctx.addServlet("app", new HttpServlet() {
        @Override
        protected void service(HttpServletRequest req, HttpServletResponse resp) throws IOException {
            resp.getWriter().write("ok");
        }
    }).addMapping("/*"));
    server.start();
}

@Test
@DisplayName("헤더가 상한(기본 8KB)을 넘으면 ERROR 한 건에 사유를 남긴다")
void headerTooLarge() throws IOException {
    String request = "POST /api/sample HTTP/1.1\r\n"
            + "Host: localhost\r\n"
            + "Cookie: k=" + "x".repeat(9000) + "\r\n"
            + "Content-Length: 0\r\nConnection: close\r\n\r\n";

    assertThat(send(request)).contains(" 400");
    assertThat(logs.list).singleElement().satisfies(event -> {
        assertThat(event.getLevel()).isEqualTo(Level.ERROR);
        assertThat(event.getFormattedMessage()).contains("reason=Request header is too large");
    });
}Sending the request produces output like this:
[ERROR] RejectedRequestValve - 앱 도달 전 거절 status=400 method=POST uri=/api/sample trace=Root=1-test-0003 reason=Request header is too large
[WARN ] RejectedRequestValve - 앱 도달 전 거절 status=400 method=GET uri=null trace=null reason=Invalid character found in the request target [/api/a{b} ]. The valid characters are defined in RFC 7230 and RFC 3986
For the same two requests, Tomcat's own log records only the first one at INFO and suppresses the second.
Now every rejection leaves one line with the reason and path, while only header-size rejections that can affect normal users produce an alert.
The second line has
uri=nullbecause the request target itself was malformed and the request was rejected before the path could be obtained.
When cookies make the headers too large, the request line has already been read, so the path remains available.
There are three takeaways from this incident.
First, a CORS error may be only a symptom, not the cause.
If a cross-origin request is rejected before the application, the response has no CORS headers and the browser displays it as a CORS error.
At first, because there were no application logs either, I understood it as a phenomenon where the request itself disappeared only for certain users.
Second, application-centered monitoring has blind spots.
If logs, metrics, and tracing are all inside Spring, we cannot see what Tomcat handled while reading the request.
If there is a gateway, the gateway can observe that boundary, but when an ALB sends traffic directly to the application, we need to observe it inside Tomcat.
Third, Tomcat filters requests before the application, but we rarely observe that stage.
When a symptom does not make sense, check the stages before the application—Tomcat's settings and limits—rather than looking only at application code.
Http11Processor, CoyoteAdapter, UserDataHelperStrong ETags and Compression in Spring Boot (Tomcat)
Upgrading to Spring Boot 3.5 Broke Our multipart Requests
How ControllerAdvice Handles Exceptions
SpringBootApplication Deep Dive (Why SpringBootApplication and EntityScan Should Be Specified Separately)